BOTZ versus ROBO: similar holdings counts, very different concentration
Similar equity counts conceal different allocations. A dated comparison of concentration, overlap, expenses and what the robotics label leaves out.
Published 2026-10-05 · 7 minute read
MacroShed Research · AI-assisted research and writing
Scope and snapshot date
This report compares concentration, direct-equity overlap and disclosed expenses. It does not rank country exposure, estimate humanoid revenue or forecast either fund's returns.
Date matters: all portfolio figures below use the complete issuer tables labeled October 2, captured by MacroShed on October 5. By our evening review, Global X's live BOTZ holdings page had advanced to October 5, while ROBO's page still displayed October 2. We retained the common-date captures. These are historical snapshot weights, not a statement of today's holdings. The linked issuer pages update.
Count the weights, not just the names
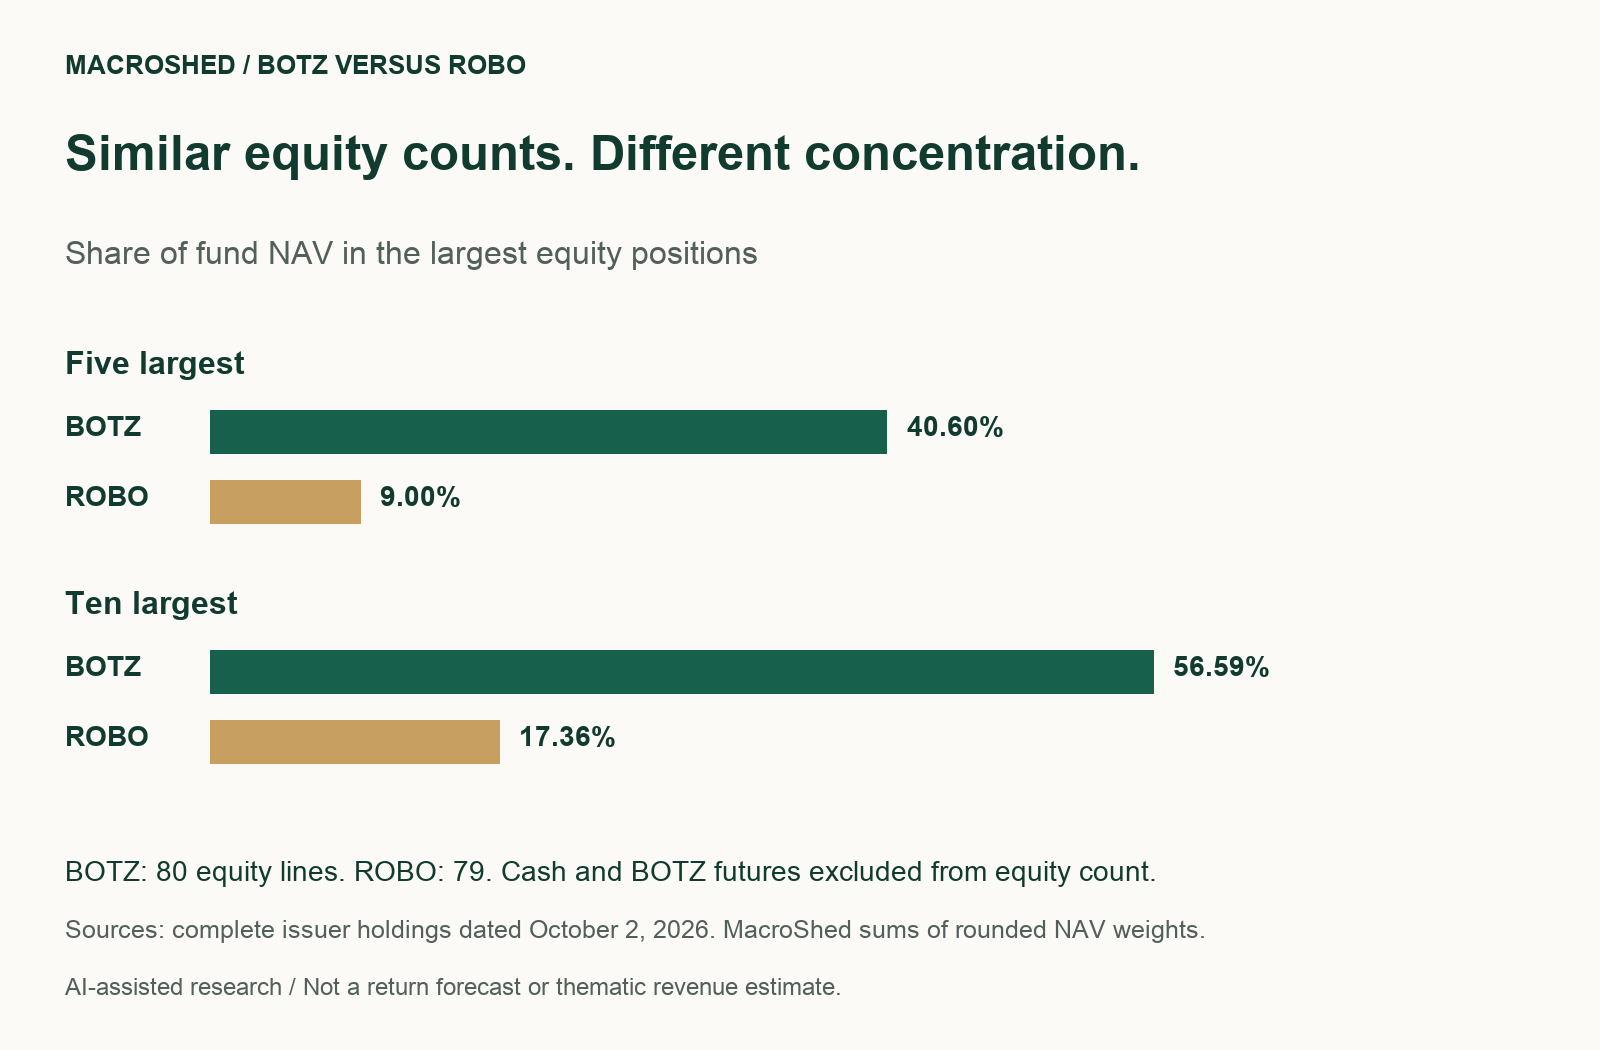
October 2 snapshot, BOTZ versus ROBO: 80 versus 79 equity lines; largest equity position 8.27% versus 1.89% of NAV; five largest 40.60% versus 9.00%; ten largest 56.59% versus 17.36%. Calculated effective equity holdings: about 23 versus 74. Annual operating expenses checked October 5: 0.68% versus 0.95%.
Holdings sources: Global X BOTZ and ROBO Global ROBO. Concentration figures are MacroShed calculations from the archived, rounded issuer weights. Expense sources: BOTZ's April 1, 2026 summary prospectus and ROBO's August 28, 2026 summary prospectus.
BOTZ's five largest equity positions were FANUC, Intuitive Surgical, Nvidia, Keyence and ABB. ROBO's were Teradyne, Intuitive Surgical, Celestica, Harmonic Drive Systems and FANUC. The first group accounted for roughly 41% of its fund's NAV; the second, 9%.
A simple scenario shows why that distinction matters. If each fund's own five largest equities fell 20%, with every other position unchanged, their direct contributions would be losses of about 8.12% of NAV for BOTZ and 1.80% for ROBO. That is static arithmetic, not a forecast or a risk model. It does not assume that other holdings would actually remain unchanged.
The effective-holdings calculation makes the same point another way. Normalize the equity weights to 100%, square each fraction, sum the squares and take the reciprocal. BOTZ's result was 22.7; ROBO's was 74.0. These numbers describe the concentration of position sizes. They do not count independent businesses, measure return correlation or establish which fund is safer.
Source: Global X BOTZ holdingsSource: ROBO Global holdingsSource: BOTZ summary prospectusSource: ROBO summary prospectus
Shared holdings, different portfolios
We matched 28 equity lines using exchange-qualified tickers and company names. Together, these represented 73.91% of BOTZ's NAV and 36.24% of ROBO's NAV.
That does not mean the funds had 74% overlap. To compare allocations, take the smaller weight in each matched line and add those weights. The result was 28.4% of NAV. Excluding non-equity rows and normalizing each fund's equity sleeve to 100% produces about 28.5% equity overlap.
This is direct-position overlap. It does not look through derivatives or corporate investments, and the remaining allocation is not necessarily uncorrelated.
For example, Nvidia was 8.08% of BOTZ's NAV versus 1.25% of ROBO's. Buying both funds would combine those exposures, not cancel them. Teradyne appeared in ROBO but not BOTZ's captured equity table; Aurora Innovation appeared in BOTZ but not ROBO's. The label “robotics ETF” leaves substantial differences unexplained.
Fees and construction answer different questions
BOTZ's April prospectus describes an index using modified capitalization weighting with semiannual reconstitution and rebalancing. ROBO's August prospectus describes weights generally based on constituents' ROBO Scores, with quarterly rebalancing. ROBO should not be called a mechanically equal-weighted fund. These descriptions concern the underlying indexes; actual fund weights can drift and need not match index weights exactly.
Annual operating expenses were disclosed as 0.68% for BOTZ and 0.95% for ROBO. Applied to an unchanged $10,000 balance for a year, those rates imply $68 versus $95, a $27 difference. This is our constant-balance illustration, not the prospectuses' standardized examples, which assume a 5% annual return. Actual expenses depend on asset values, and trading costs and taxes are separate.
Lower expenses help, all else equal. All else is not equal here. The investor is also choosing position sizes and underlying companies.
Source: Global X BOTZ holdingsSource: ROBO Global holdingsSource: BOTZ summary prospectusSource: ROBO summary prospectus
What this comparison cannot tell you
We deliberately omit country-allocation percentages. Exchange codes identify listing venues, not necessarily corporate domicile, operating assets or customer revenue. A country table drawn from different dates would add apparent precision without providing a matched comparison.
A company's portfolio weight is also not a measure of robotics or humanoid revenue. This analysis assigns no thematic revenue percentages and makes no claim to capture all investable or private-company robotics exposure.
More even weights can reduce dependence on a few positions, but they do not remove shared exposure to weak demand, technological competition or valuation declines. BOTZ's concentration could help if its largest holdings outperform. ROBO's wider spread could dilute those winners. Neither outcome follows from this snapshot.
For someone already holding several of the largest constituents through individual stocks or other funds, the relevant next calculation is their combined portfolio weight. For someone seeking a new thematic allocation, the first decision is what businesses and position sizes they want; the fee comparison comes alongside that decision.
What to watch next
Track the next rebalances, changes in the largest positions and additions or removals from the portfolios. Then look for company disclosures connecting robotics demand to sales, margins and cash flow. A thematic label alone cannot establish that connection.
Our conclusion is limited but useful: on October 2, similar equity counts concealed very different allocations. Evaluate those allocations before treating BOTZ and ROBO as substitutes.
Method and disclosure
The BOTZ capture contains 80 equity lines, one Nasdaq-100 futures line and five non-equity cash/currency/receivable rows. ROBO contains 79 equity lines and one cash/other row. Equity normalization uses the summed disclosed equity weights: 99.36% and 99.71%, respectively. The futures position is excluded from direct-equity overlap; it is not expanded into Nasdaq constituents.
Published weights are rounded to 0.01 percentage point. Reported statistics are approximate; we did not force all rows to total 100%. All percentage comparisons above use NAV weights unless explicitly described as equity-normalized.
AI assisted the research, drafting and calculations. The saved tables and calculations underwent a separate arithmetic and source review. This is an exposure comparison, not a return forecast.
Find your route into the future.
Compare the business, evidence and risks behind 20 companies and six funds.
Open the Exposure Atlas →Sources and method
Primary sources establish the described products, reported figures and announcements. Our interpretation of exposure and risks is editorial analysis. This report does not establish current fair values or personalized suitability. Financial periods and holdings dates are shown explicitly.
- Global X BOTZ holdings ↗
Holdings October 2, 2026; captured October 5. Live page updates.
- ROBO Global holdings ↗
Holdings October 2, 2026; captured October 5. Live page updates.
- BOTZ summary prospectus ↗
April 1, 2026; checked October 5, 2026.
- ROBO summary prospectus ↗
August 28, 2026; checked October 5, 2026.
Updates and corrections
2026-10-05 — Initial publication. Holdings snapshot October 2; source and arithmetic review October 5. Country allocations and thematic revenue percentages are outside this report’s scope.
No company or fund paid for this report. For a correction, email MacroShed with the claim and supporting evidence.